Transport prices edge upwards in April, in line with the 2023 trend
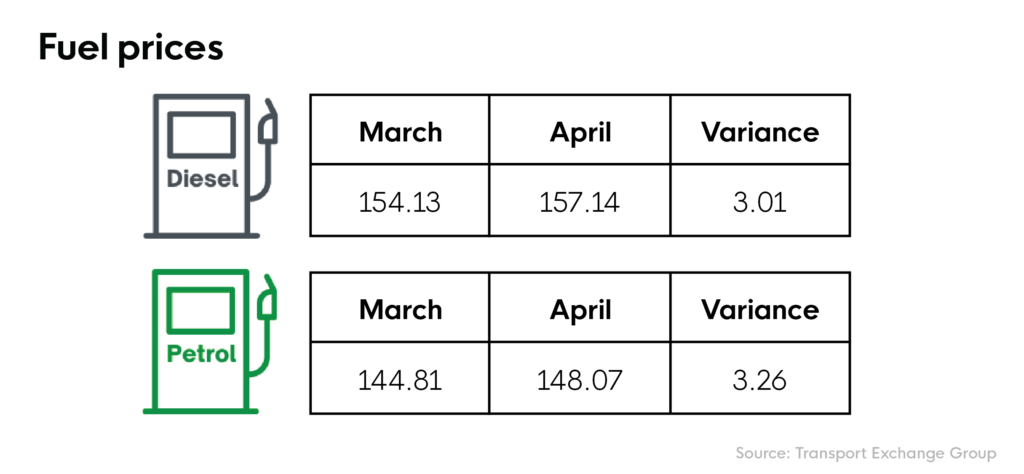
The TEG index continues to climb following Easter and fuel prices follow suit.
Integra makes sense of the road transport landscape. Get more insight with Integra, TEG’s enterprise solution.
Index trends at a glance
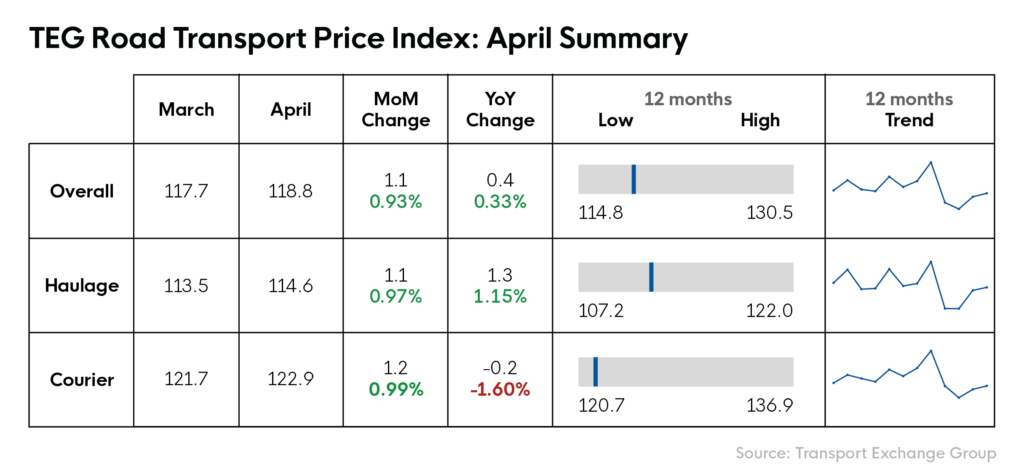
April 2024 saw a further rise in the TEG Road Transport Index, following a low of 114.5 in February. The April index now stands at 118.8; 1.1 points and 0.93% higher than figures observed in March 2024. Year-on-year, however, the rise is only 0.33%, suggesting that current prices broadly reflect those seen at this time last year.
Haulage prices also rose by 1.1 points in March (0.97% month-on-month). This represents a slightly higher year-on-year jump of 1.15%.
Looking at the price index for couriers, the same pattern can be seen month-on-month. The index rose 1.2 points (0.99%) in April. Interestingly, year-on-year courier prices fell slightly by 0.2 index points. While this could be an isolated blip, the industry will, no doubt, keep a close eye on how courier prices move in May.
Given the general deflationary trend of the courier index since July 2023 and the latest DfT traffic data (which shows no increase in traffic volumes for light commercial vehicles), it could be that businesses have invested in surplus vans, driving courier prices down.
Want to see more in depth data? Click below to visit the Integra Market Data Reports
Providing vital insight into the transport industry that the UK depends upon
The TEG Road Transport Price Index provides a monthly overview of the price-per-mile cost for vehicles used in the UK's haulage and courier industry. This index considers various factors, including supply and demand levels as affected by Brexit, Covid-19, driver shortages, and other economic factors.
Stay up-to-date on the latest trends and pricing in the UK's road transport industry by following the TEG Road Transport Price Index.
What is the TEG Road Transport Price Index
- Charts the price-per-mile cost for UK haulage and courier vehicles each month
- Uses data from over four million aggregated and anonymised transactions
- Provides valuable insights to policymakers and industry operators alike
- Tracks changes and highlights market trends

Industry benchmarking
Single source of truth
Quick view on market trends
The TEG Road Transport Index: Accurate Tracking of Price per Mile
The TEG Road Transport Index is a comprehensive tool that uses an arithmetic weighting system to track changes in Price per Mile (PPM) each month. The index is based on a January 2019 baseline and uses the Paasche formula to apply weighting according to the mileage mix from each vehicle type. This ensures that each month's PPM is compared accurately with the base month. Stay informed with the industry's leading metric for transportation costs.
The data is gathered, anonymised, and aggregated from over two million spot market loads transacted across the TEG platforms, before being validated, analysed and published.
PPM = (sum order values) / (sum order miles)
Sample size is circa 2m orders per annum across c. 8,000 participants.
Data ID: A3, B3, C3
View full reports